
As we usher in the new year of 2024, Kurve is thrilled to announce the release of V1.24, a significant milestone that is being affectionately referred to as the "Champagne Release." With the introduction of an exciting new feature (conditional formatting!) and enhancements in-hand, this version is designed to elevate your data reporting experience to new heights. Let's pop the cork and dive into the release notes to discover the sparkling gems that await you.
Click on a feature below to jump right to or scroll and read on!
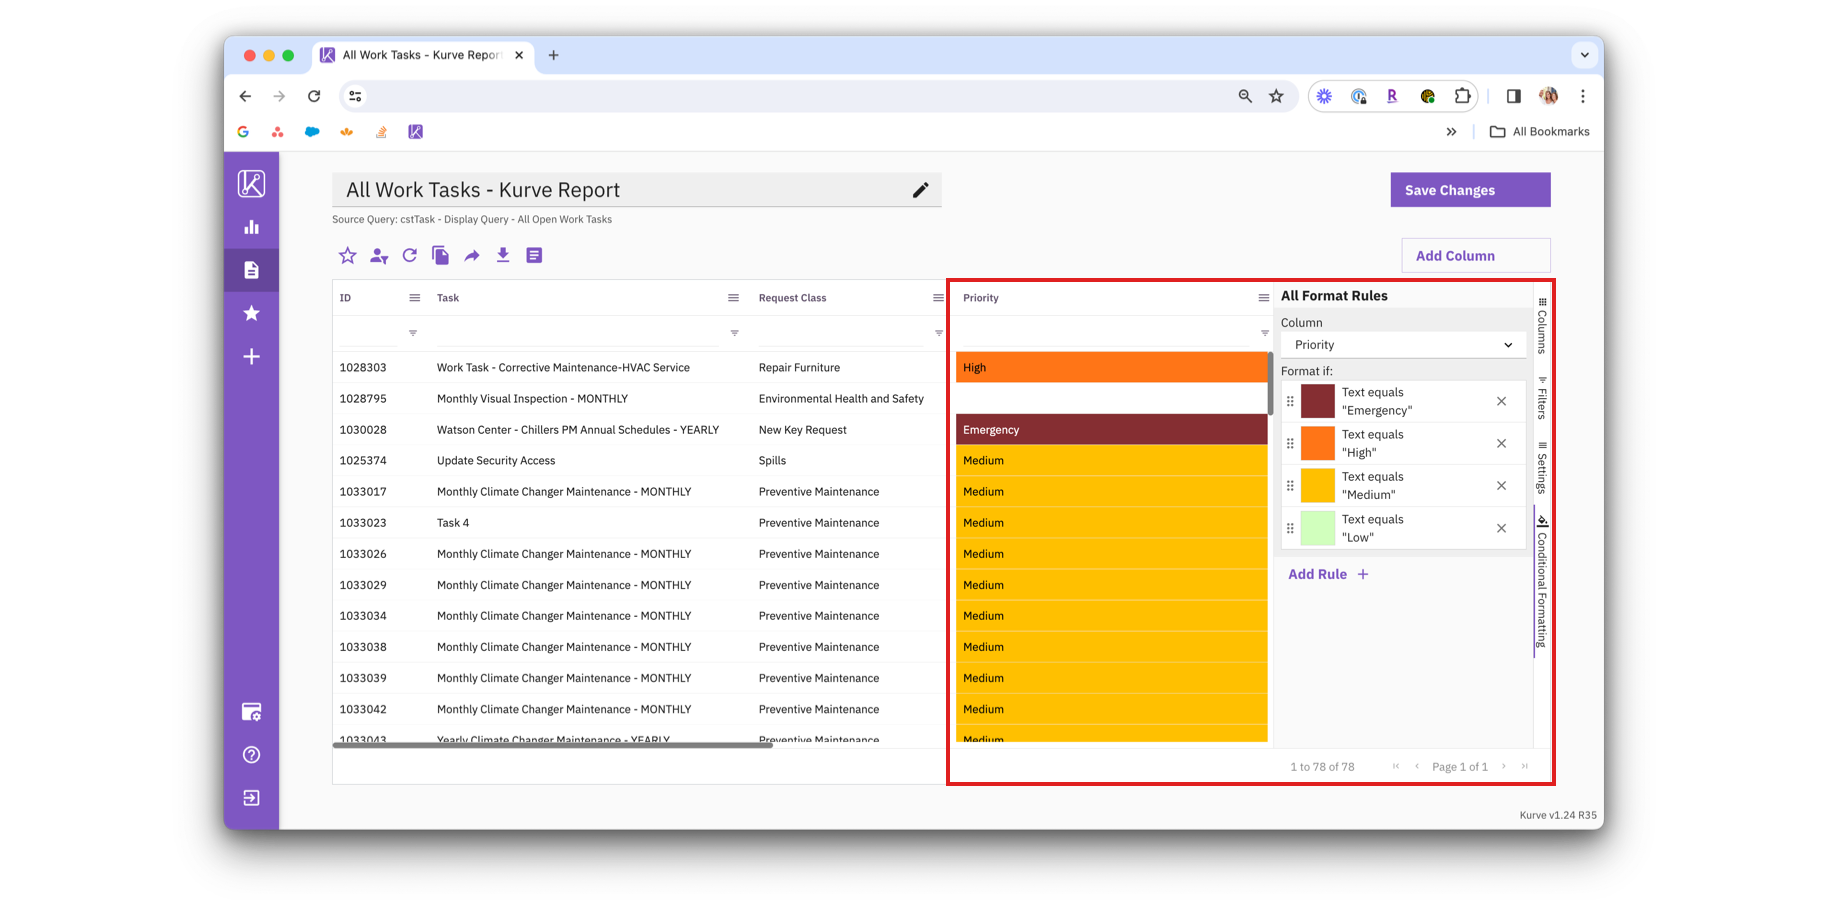
Kurve understands the importance of visualizing data trends quickly and effortlessly. With V1.24, a new conditional formatting interface has been introduced as a game-changing feature for end users.
Don’t worry, for those who love creating Custom Columns, you can still highlight cells with color based on specific criteria in the same way you always have. With the new conditional formatting interface, however, you can dynamically highlight cells with vivid colors directly in the Kurve report view, making data interpretation a breeze. This feature not only saves time but also adds a vibrant touch to your reports, enabling you to uncover patterns and anomalies at a glance.
Conditional Formatting is a powerful tool in the realm of data analysis and reporting. It allows users to dynamically format cells based on specific conditions or criteria. This feature is particularly valuable when dealing with large datasets, as it enables users to visually highlight trends, patterns, or outliers without the need for manual sorting or filtering.
Traditionally, users often had to rely on complex formulas or scripts to apply conditional formatting in tools like Excel. However, Kurve's V1.24 revolutionizes this process by introducing a more intuitive and user-friendly approach. Now, highlighting cells with specific colors based on their values is as simple as a few clicks, eliminating the need to input the ‘Color Column Snippet’ Function and parameters in the Kurve Custom Column Expression window.
In the world of data analysis, efficiency is key. While both Conditional Formatting and Kurve Custom Columns serve the purpose of enhancing data visibility, they differ in their approach and application.
Conditional Formatting:
Custom Columns:

Either way, you can achieve the same results using conditional formatting or a custom column to highlight your data with color. It’s up to you to decide which approach you want to take!
Ultimately, Conditional Formatting in Kurve's V1.24 is not just a feature; it's a strategic choice to enhance your data analysis flow. By simplifying the process of highlighting cells based on specific conditions, Kurve empowers users to uncover insights faster, ensuring that the journey from raw data to meaningful visualization is seamless and efficient.
Time is a critical dimension in data analysis, and Kurve understands the need for precision in date filtering.
Existing filter types for dates in graphs have included:
With V1.24, two (2) new graph filter types for date fields has been added:

These additions provide control over your date-based analyses, allowing you to pinpoint specific time ranges effortlessly. Whether you are exploring historical trends on work orders or projecting future patterns in upcoming leases expiring, these new filter types empower you to navigate the temporal dimension of your data with accuracy.
You asked, we listened! Kurve's V1.24 introduces an Excel export enhancement that provides the level of detail you requested. Now, every time you export your data to Excel, the file name includes a date/time stamp.This seemingly simple addition is a game-changer, ensuring that your exported files are not only organized but also timestamped for future reference. It's a small detail that makes a big difference, streamlining your workflow and enhancing overall data management.

This is a friendly reminder and plug to make sure you submit your feature requests. Kurve has become the tool it is today because of your ideas for enhancements – thank you and keep ‘em coming!


Kurve is a user-friendly tool which means it pays attention to the minutest of details. In V1.24, the placement of hover descriptions in the Data Setting interface have been optimized for enhanced readability.
The user interface is the gateway to your data journey, and these minor enhancements contribute to a smoother and more intuitive experience. It's all about perfecting the details to ensure that your focus remains on the data, not on navigating the platform.
Kurve's "Champagne Release" V1.24 is not just a collection of features; it's a celebration of efficiency, precision, and user-centric design. As you explore the enhanced conditional formatting, refined date filtering, time-stamped Excel exports, and improved pivot tables, you'll discover a seamless and delightful data analytics experience.
Let’s toast to the first release of the new year! Cheers to a data-driven journey, smarter insights, and more user-friendly features in store for 2024!
.png)


.png)


